dx4nqvbtu06bx: THE RECURRING QUERY IN THE 11.2.0.4 TARGET DATABASE IS EXTREMELY SLOW AND USES LOTS OF TEMPORARY SPACE
The following error messages are frequently generated in the database alert log
ORA-1652: unable to extend temp segment by 128 in tablespace TEMP02
Sat May 23 07:09:32 2020
ORA-1652: unable to extend temp segment by 128 in tablespace TEMP02
Sat May 23 07:09:34 2020
ORA-1652: unable to extend temp segment by 128 in tablespace TEMP02
Sat May 23 07:09:39 2020
ORA-1652: unable to extend temp segment by 128 in tablespace TEMP02
If the temporary tablespace is big enough, there would be no errors like those, but you can confirm high usage of temp tablespace by querying the DBT_TEMPUSAGE view.
SELECT * FROM DBT_TEMPUSAGE WHERE STATUS='ACTIVE' AND TEMP_USED_GB>0;

USERNAME   SID SERIAL# PID  STATUS   SQL_ID        ELAPSED_SEC EVENT                       CONNNECTED_FROM TABLESPACE  SEGTYPE TEMP_USED_GB PERCENT_USED
-------- ----- ------- ---- -------- ------------- ----------- --------------------------- --------------- ----------- ------- ------------ ------------
DBSNMP     634    5349 6362 ACTIVE   dx4nqvbtu06bx         595 direct path write temp      dbpilot.net     TEMP02      HASH           106.9         83.5
DBSNMP    2907   56461 1191 INACTIVE                         6 SQL*Net message from client dbpilot.net     TEMP02      LOB_DATA           0            0
In this demo, the query dx4nqvbtu06bx uses 83.5% (106.9GiB) of all available space in TEMP2 tablespace.
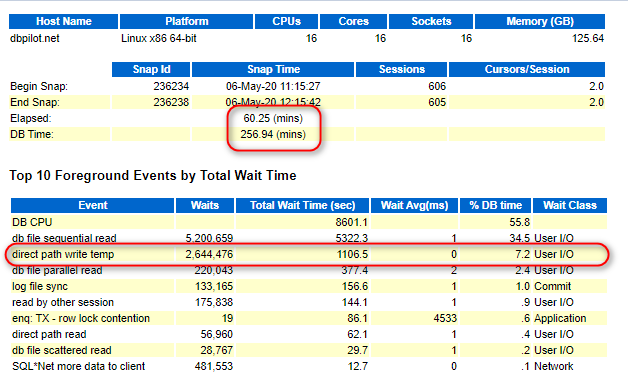
In an AWR report of the database, the following can be observed:
1. A high value for the direct path write temp wait event
2. A high elapsed time for the statement with the sql_id dx4nqvbtu06bx

SQL execution statistics from V$SQL view show that most of the query elapsed time is IO wait time
**************************************** : ******************
                                  SQL_ID : dx4nqvbtu06bx
                                  Child# : 0
                           Cursor Status : VALID
                     Is Cursor Obsolete? : N
                          Parsing Schema : DBSNMP
                        System Timestamp : 08-05-2020 11-52-50
                               First Run : 2020-04-26/18:25:08
                        Last Active Time : 08-05-2020 11-52-48
                   Elapsed Time Total(s) : 520116.41
                       CPU Time Total(s) : 207325.58
                   IO Wait Time Total(s) : 319430.49
          Concurrency Wait Time Total(s) : 5.66
          Application Wait Time Total(s) : 0
              Cluster Wait Time Total(s) : 0
                              Executions : 942
                Elapsed Time per Exec(s) : 552.14
                    CPU Time per Exec(s) : 220.09
                IO Wait Time per Exec(s) : 339.1
       Concurrency Wait Time per Exec(s) : .01
       Application Wait Time per Exec(s) : 0
           Cluster Wait Time per Exec(s) : 0
                                         :
                              Disk Reads : 154609
                             Buffer Gets : 455867
                           Direct Writes : 2175471508
                           Row Processed : 0
                                         :
                       Number of latches : 0
                             Sql Profile :
                        Sql Command Type : 3
**************************************** : ******************
In this demo, the IO wait time of the query is about 61% of Elapsed Time.
Apply patch 14078947 on the target database.
1. Use a rule hint in the query as follows (which would have to be modified using the DBMS_SPM package):
AND SESSION_RECID=:B2 AND SESSION_STAMP=:B1 AND DEVICE_TYPE = 'SBT_TAPE' AND ROWNUM = 1;
2. Execute the following against the target database:
This workaround doesn't help much. The query still uses lots of temporary space.
exec dbms_stats.LOCK_TABLE_STATS('SYS','X$KCCRSR');
alter system flush shared_pool;
alter system flush shared_pool;
3. To disable the metric which executes this query from Enterprise Manager, please refer to MOS Doc ID 2235163.1.
EXEC DBMS_STATS.GATHER_TABLE_STATS('SYS','X$KCCBS');
EXEC DBMS_STATS.GATHER_TABLE_STATS('SYS','X$KCCRSR');
EXEC DBMS_STATS.GATHER_TABLE_STATS('SYS','X$KSFQP');
EXEC DBMS_STATS.GATHER_TABLE_STATS('SYS','X$KRBMRST');
Patch 14078947 fixed the issue with the performance of the query dx4nqvbtu06bx. New query execution statistic is the following
*************************************** : ******************
                                  SQL_ID : dx4nqvbtu06bx
                                  Child# : 0
                           Cursor Status : VALID
                     Is Cursor Obsolete? : N
                          Parsing Schema : DBSNMP
                        System Timestamp : 15-07-2020 12-08-31
                               First Run : 2020-06-20/17:03:10
                        Last Active Time : 15-07-2020 12-03-12
                   Elapsed Time Total(s) : 2422.46
                       CPU Time Total(s) : 1269.47
                   IO Wait Time Total(s) : .21
          Concurrency Wait Time Total(s) : 0
          Application Wait Time Total(s) : 0
              Cluster Wait Time Total(s) : 0
                              Executions : 6002
                Elapsed Time per Exec(s) : .4
                    CPU Time per Exec(s) : .21
                IO Wait Time per Exec(s) : 0
       Concurrency Wait Time per Exec(s) : 0
       Application Wait Time per Exec(s) : 0
           Cluster Wait Time per Exec(s) : 0
                                         :
                              Disk Reads : 223
                             Buffer Gets : 9899
                           Direct Writes : 0
                           Row Processed : 6002
                                         :
                       Number of latches : 0
                             Sql Profile :
                        Sql Command Type : 3
 *************************************** : ******************
The Elapsed Time of the query reduced significantly.
EM 13c: After Upgrade to Enterprise Manager 13.2 Cloud Control, a Recurring Query in 11.2.0.4 Target Database (SELECT MEDIA FROM V$BACKUP_PIECE_DETAILS) Takes Five Minutes, Using Huge Amount of Temp Space (Doc ID 2201982.1)
Bug 14078947 - Select from V$RMAN_STATUS very slow when database is open (Doc ID 14078947.8)
Queries on V$RMAN_STATUS are Very Slow Even After GATHER_FIXED_OBJECTS_STATS is Run (Doc ID 1525917.1)
EM13c : A Recurring Query in Database targets has performance issues (SELECT MEDIA FROM V$BACKUP_PIECE_DETAILS) (Doc ID 2235163.1)
"ORA-1652: Unable To Extend Temp Segment By 128 In Tablespace TEMP" Due to X$ Tables (Doc ID 2575123.1)