g0bggfqrddc4w: PL/SQL LOCK TIMER EVENT TAKES UP THE MOST OF DBTIME
In an AWR report or a Statspack report, the PL/SQL lock timer wait event is in the Top Wait Events list.
The PL/SQL lock timer is a large part of the database time, and its average wait time is about 60 seconds (60000 ms).
The Oracle Enterprise Manager Cloud Control 13c is used to monitor a database.
Top 5 Timed Events                                                    Avg %Total
~~~~~~~~~~~~~~~~~~                                                   wait   Call
Event                                            Waits    Time (s)   (ms)   Time
----------------------------------------- ------------ ----------- ------ ------
CPU time                                                     5,812          51.2
PL/SQL lock timer                                   61       3,660  60007   32.3
db file sequential read                        683,073         594      1    5.2
gc current block 2-way                         657,725         274      0    2.4
db file scattered read                          14,748         197     13    1.7
          -------------------------------------------------------------
The following queries plsqllocktimer_s or plsqllocktimer_c show that waiting sessions on the PL/SQL lock timer wait event are executing the g0bggfqrddc4w statement
INSTANCE_HOSTNAME INST_ID DB_USER PID   SID  SERIAL# CONNECTED_FROM CONNECTED_BY PORT  APPLICATION      WAITING_SEC SQL_ID        CHILD#  EXECUTIONS SQLTEXT
----------------- ------- ------- ----- ---- ------- -------------- ------------ ----- ---------------- ----------- ------------- ------- ---------- -------------------------------
db-ec-1.local           1 SYS     14325 2025   20393 db-ec-1.local  oracle       41862 JDBC Thin Client          32 g0bggfqrddc4w       0      27954 BEGIN dbms_lock.sleep(60); END;
db-ec-2.local           2 SYS     31521  324   46296 db-ec-2.local  oracle       10176 JDBC Thin Client          12 g0bggfqrddc4w       0       1412 BEGIN dbms_lock.sleep(60); END;
The netstat command shows the port of the connected session is being used by the Management Agent
oracle@db-ec-1:<ECPROD_1> netstat -tulpan |grep :41862 | grep ESTABLISHED

(Not all processes could be identified, non-owned process info
 will not be shown, you would have to be root to see it all.)
tcp        0      0 10.82.130.125:1521      10.82.130.84:41862      ESTABLISHED -
tcp6       0      0 10.82.130.84:41862      10.82.130.125:1521      ESTABLISHED 12414/java
oracle@db-ec-1:<ECPROD_1> ps -fe |grep 12414 |grep -v grep

oracle   12414 12355  0 Aug19 ?        00:04:51 /agent13c/agent_13.3.0.0.0/oracle_common/jdk/bin/java -Xmx134M
-XX:MaxPermSize=160M -server -Djava.security.egd=file:///dev/./urandom -Dsun.lang.ClassLoader.allowArraySyntax=true
-XX:-UseLargePages -XX:+UseLinuxPosixThreadCPUClocks -XX:+UseConcMarkSweepGC -XX:+CMSClassUnloadingEnabled
-XX:+UseCompressedOops -Dwatchdog.pid=12355 -cp /agent13c/agent_13.3.0.0.0/jdbc/lib/ojdbc7.jar:
/agent13c/agent_13.3.0.0.0/ucp/lib/ucp.jar:/agent13c/agent_13.3.0.0.0/oracle_common/modules/jsch-0.1.53.jar:
/agent13c/agent_13.3.0.0.0/oracle_common/modules/com.oracle.http_client.http_client_12.1.3.jar:
/agent13c/agent_13.3.0.0.0/oracle_common/modules/oracle.xdk_12.1.3/xmlparserv2.jar:
/agent13c/agent_13.3.0.0.0/oracle_common/modules/oracle.dms_12.1.3/dms.jar:
/agent13c/agent_13.3.0.0.0/oracle_common/modules/oracle.odl_12.1.3/ojdl.jar:
/agent13c/agent_13.3.0.0.0/oracle_common/modules/oracle.odl_12.1.3/ojdl2.jar:
/agent13c/agent_13.3.0.0.0/lib/optic.jar:/agent13c/agent_13.3.0.0.0/sysman/jlib/log4j-core.jar:
/agent13c/agent_13.3.0.0.0/jlib/gcagent_core.jar:/agent13c/agent_13.3.0.0.0/sysman/jlib/emagentSDK-intg.jar:
/agent13c/agent_13.3.0.0.0/sysman/jlib/emagentSDK.jar oracle.sysman.gcagent.tmmain.TMMain
The query g0bggfqrddc4w is executed by the Management Agent as part of the DB Real Time Monitoring feature.
The Management Agent maintains the persistent connection with the database and executes the query every single minute. This allows the agent to know immediately if the database goes down.
The DB Real Time Monitoring feature is enabled only if the monitoring user has the EXECUTE privilege on the DBMS_LOCK package in the target database(eg SYS user).
To eliminate the query g0bggfqrddc4w and the related PL/SQL lock timer wait event in the database, do not use administrative user accounts like SYS or SYSTEM. Use the DBSNMP user without the execute privilege on the DBMS_LOCK package (by default, it hasn’t).
SQL> REVOKE EXECUTE ON SYS.DBMS_LOCK FROM DBSNMP;

Revoke succeeded.
Without the EXECUTE privilege on the DBMS_LOCK package, the Management Agent determines the database status with the Response metric. By default, the Response metric collects database status every 15 seconds.
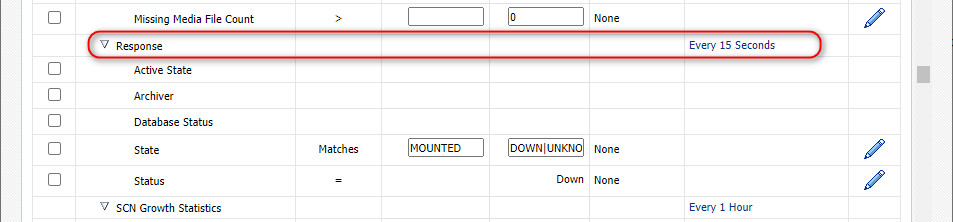
It's up to you to enable or disable the DB Real Time Monitoring feature but using the Response metric to monitor the database status is enough for many cases.
How To Identify Sessions Which Cause PL/SQL LOCK TIMER Wait Event (Doc ID 434265.1)
EM 12c, EM 13c: Why does Agent execute "BEGIN Dbms_lock.sleep(60)" statement Having SQL ID "g0bggfqrddc4w" in the Target Database ? (Doc ID 2366263.1)